

Model Comparison: Some details are beginning to surface. One of those is a strengthening trend with the upper-level energy as the tilt of that energy pivots... the more the tilt is to the RIGHT, the better the chances of the cold air cooperating with the precipitation. I have drawn a "black line" to mark the tilt and it bisects the center at "X" or "N" of the upper-level energy responsible for producing precipitation and bringing in the cold air. The maps show corresponding upper-level energy and precip (same timeframe).
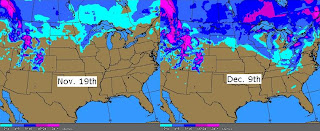
Also, as Matt has pointed out many times, when a cold snap presents itself... it's important show the increase in US snow-cover. That increase is obvious since November 19th.
Reason for posting the map bbove is to emphasize next week's cold snap. The arctic air in the forecast for next week will travel over a vast amount of snow cover. A considerable area of 4-8" currently exists in the upper midwest and 4-8" also exists in Western NC. Most of that snow has been produced by this latest cold snap. More snow will also fall from the low pressure system headed toward the Great Lakes on Saturday. Numbers will come crashing down. December standards (averages) won't be touched and records may fall next week.
Tidak ada komentar:
Posting Komentar